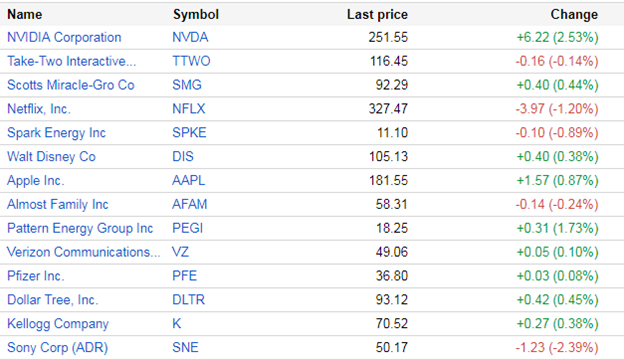
Scraping Stock Data from Google Finance
For this tutorial we will be using Google Sheets. Google Sheets is a great resource for scraping data from the internet and it’s free!
For this tutorial we will be using Google Sheets. Google Sheets is a great resource for scraping data from the internet and it’s free!
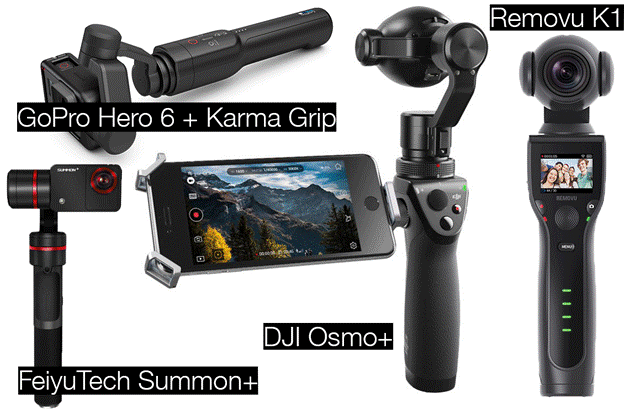
The GoPro was one of the biggest revolutions when it came to shooting live action footage. Unfortunately, what many people weren’t aware of was with any camera, shooting video is incredibly difficult without a stabilizer. You end up with a lot of shaky cam and unusable footage, even with a warp stabilizer during post production. …
Removu K1 vs DJI Osmo+ vs GoPro Hero6/Karma vs Feiyutech Summon+ Read More »

Backstory A few months ago I had a genius idea. I could create a personal website with Ruby on Rails and host it on Heroku for free using a Free Plan and a monitor robot to keep the website awake. The only thing I’d have to pay for is a domain name that I could …